Correlations
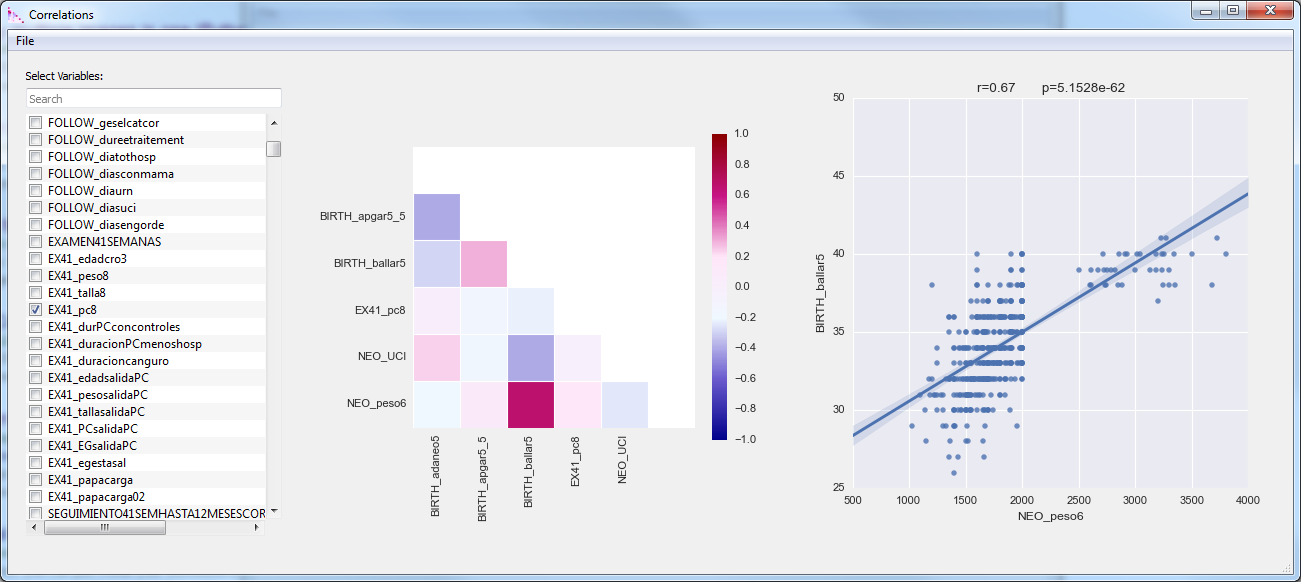
Using this application you can rapidly explore correlations between the variables in the database. It’s interface is divided in three frames, at the very left a list of variables, in the middle a correlation matrix, and at the right a scatter plot.
Notice this application is also available to use outside of braviz as correlation viewer
Selecting Variables and Samples
To select the group of variables among which you want to find correlations use the checkboxes in the list at the left. As usual you may use the search field to find variables faster. As you select variables you will see the scatter matrix change.
The file menu contains an option labeled change sample which lets you select a different set of subjects to work with.
The correlation matrix
The correlation matrix is shown in the middle of the application. Each pair of variables have one corresponding square in the matrix, variables are sorted in alphabetical order. The color of each square depends on the correlation coefficient (pearson) between the two variables. If you hold the mouse over any square you will see the exact value of this coefficient. If you click on any square, a scatter plot of the two variables will be shown on the roght panel.
The scatter plot
The scatter plot can give you a better idea of the correlation between the two variables. A regression line and confidence interval is also shown. It is also interactive. If you hold the mouse over any of the points, you will see its id and the exact values of the two variables. If there are several points at that location, you will see multiple values.
At the top of the scatter plot you will see the correlation coefficient and an approximation of the associated p value.
Hint
You may click on points in the scatter plot to temporally remove them from the analysis. The regression line, confidence interval, correlation coefficient and p value will be updated. To add them back, just click on them again.
Exporting plots
In the file menu you will find options for exporting the correlation matrix and the scatter plot.