D3 based visualizations
The Java Script library D3 allows to create rich interactive graphics. It is of course targeted at web visualizations, and is meant to run on a web browser. In order to integrate this with the rest of braviz, which is written in python, we will use the twister web server to send appropriate html to the browser, and to receive messages (requests). We are still missing a mechanism to send further messages to the browser once the page is loaded. This could be done by polling at a particular address and keeping track of message numbers
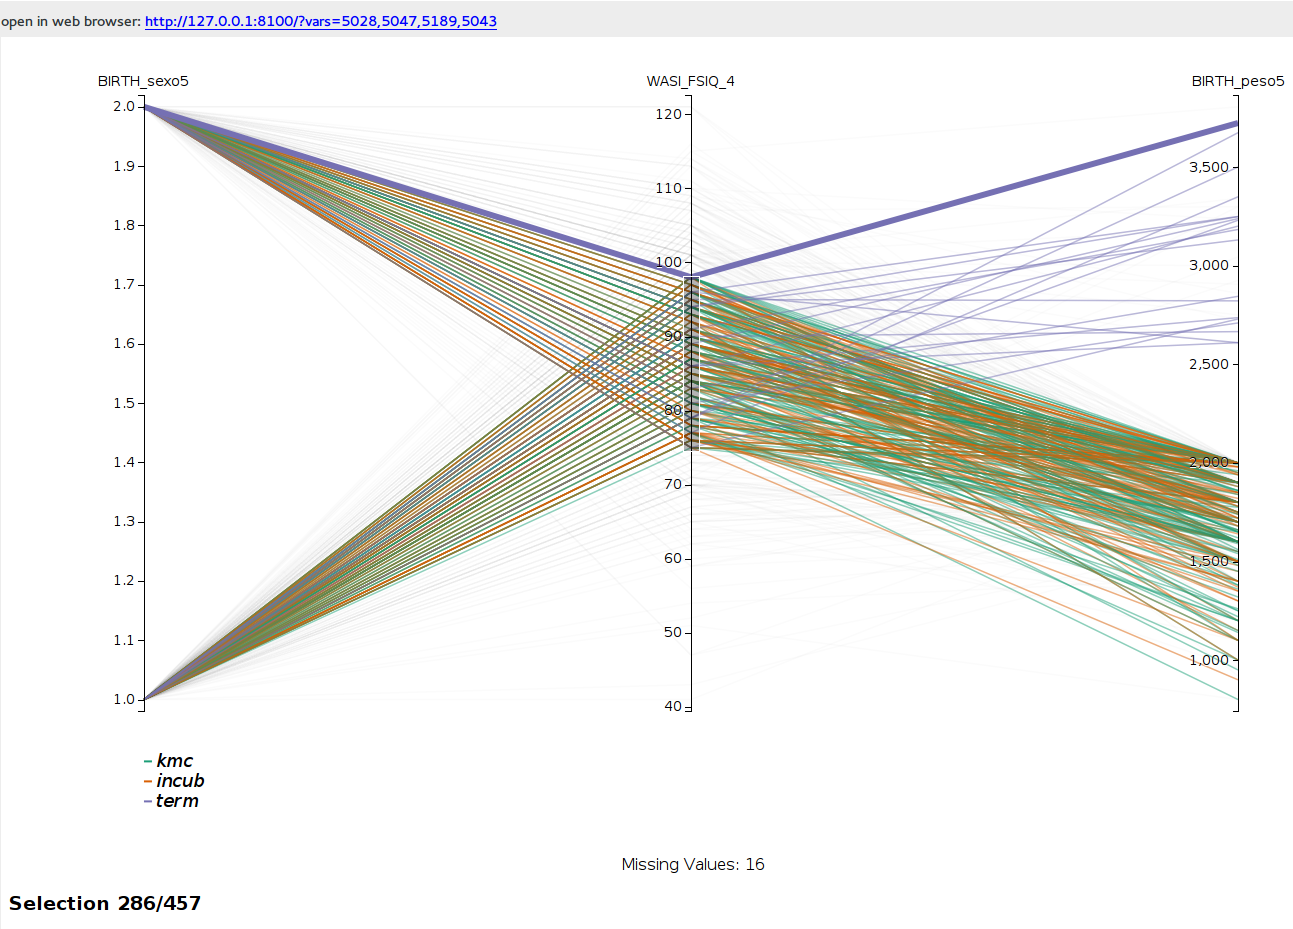
Parallel Coordinates
-
class
ParallelCoordinatesHandler(application, request, **kwargs)[source]¶ Implements a parallel coordinates view from variables in the database
It is based on the parallel coordinates d3 example
The GET method receives as arguments:
category : Id of a variable to use as categories, lines will be colored according to this variable
- vars : A list of variable ids to include in the parallel coordinates, in order
If it is not given, the default from the configuration file are used
- sample : A sample ID for subjects to include in the visualizaiton, if None is given the whole dataset
is displayed
It returns a parallel coordinates web page, by rendering the template
parallel_coordinates.htmlfound insideweb_templatein the directory containing thebraviz.visualizationmodule.The POST method is used to save samples from the visualization, it receives the following arguments
- sample_name : Name for the new sample
- sample_desc : Description for the new sample
- sample_subjects : Subject ids inside the new sample
It returns a 409 error code if the sample_name already existed, or
okwith code 200, if the sample was successfully saved